THE STARTING POINT
Break-even depends on contribution, fixed costs and the sales mix you actually expect to deliver.
Understand the question break-even analysis answers
Break-even analysis estimates the sales volume or revenue needed to cover the costs included in a model. It is useful when assessing a new service, a price change, additional fixed cost or a business plan. The result is a threshold under stated assumptions, not a forecast that customers will buy enough or a guarantee that the business will have sufficient cash.
The calculator below uses a single-product or comparable-service model. Enter fixed costs for a period, selling price per unit and variable cost per unit. It calculates contribution, contribution margin, break-even units and break-even revenue. Use consistent units and the same time period throughout the calculation.
For a mixed business, the model needs more care because different services produce different contribution. You can analyse a defined service separately or build a weighted model based on a credible sales mix. Do not average prices and costs casually if the mix is likely to change. A neat result can be misleading when the underlying unit does not represent the work the business actually sells.
Separate fixed and variable costs for the decision
Fixed costs remain broadly unchanged within the relevant activity range and period. They might include rent, management salaries or a software platform. Variable costs increase with the unit sold, such as materials, delivery subcontracting or a per-sale commission. Some costs are mixed or change in steps, so the classification requires judgement.
Use the purpose of the analysis to decide which costs belong. A full business break-even model should include the relevant ongoing fixed costs. An incremental decision about a new service may focus on additional costs, while recognising that existing capacity has limits and alternative uses. State the boundary so readers do not mistake an incremental calculation for the profitability of the whole company.
Check the period carefully. Monthly fixed costs should be compared with monthly sales volume. An annual cost allocated monthly is divided by twelve, while a quarterly total allocated monthly is divided by three. Keep applicable tax treatment consistent and confirm material classifications with the finance owner rather than relying on a generic template.
Calculate contribution and the break-even point
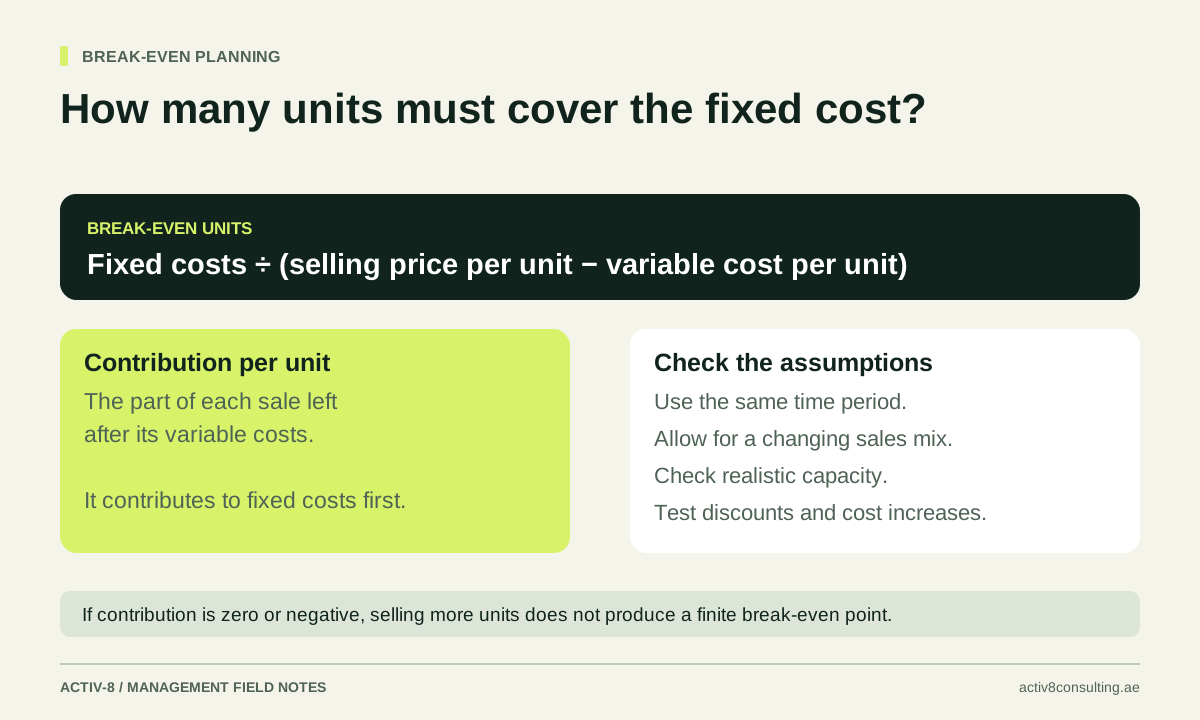
Contribution per unit equals selling price minus variable cost per unit. Break-even units equal fixed costs divided by contribution per unit. Break-even revenue can be calculated as fixed costs divided by the contribution margin ratio, where that ratio is contribution divided by selling price. The US Small Business Administration presents the same basic single-product break-even relationship.
Suppose an illustrative service sells for AED 1,000, has AED 600 of variable cost and carries AED 40,000 of monthly fixed costs in the model. Contribution is AED 400 per service. Dividing AED 40,000 by AED 400 gives 100 services per month to break even. At the stated price, that corresponds to AED 100,000 of revenue.
If the calculated number of units is fractional and the unit cannot be divided, round up for the operational sales requirement. The tool shows whole units needed and the associated revenue. It also shows the mathematical revenue threshold so the distinction is clear. Neither output says whether the business has the demand or capacity to achieve the required volume.
Handle zero or negative contribution correctly
If selling price equals variable cost, each additional sale contributes nothing towards fixed costs. If selling price is below variable cost, additional sales increase the loss before fixed costs. In either case, a positive fixed-cost base has no finite break-even volume in this simple model. The calculator flags that condition rather than dividing by zero or producing a negative target.
This can occur when a price is discounted without changing scope, when delivery costs are understated or when a service is sold as a deliberate loss leader. A loss-leading strategy requires a separate, evidence-based assessment of the wider customer economics. It should not be justified by assuming that more volume will eventually repair a negative unit contribution.
Check whether a cost is genuinely variable and whether the model omits later revenue or cost. Correct the model if necessary, but do not change definitions merely to obtain a positive answer. The pricing strategy guide explains how discounts affect contribution and the additional volume required to preserve the original economics when contribution remains positive.
Test price, cost and volume scenarios
Change one assumption at a time to understand the sensitivity. In the illustrative example, increasing variable cost from AED 600 to AED 650 reduces contribution to AED 350. Break-even rises from 100 to approximately 114.3 units, meaning 115 whole services if units cannot be divided. That is a material operational change from a relatively modest cost movement.
Similarly, a 10% discount reduces the selling price to AED 900 while variable cost remains AED 600. Contribution becomes AED 300, so the mathematical break-even volume is approximately 133.3 services, or 134 whole services. The business must assess whether demand and delivery capacity can support that requirement.
Model additional fixed cost where it appears. If serving the higher volume requires another supervisor or vehicle, the original fixed-cost assumption may no longer hold. This creates a step change rather than a smooth extension of the same line. The capacity planning calculator helps identify when the operational assumptions need to change alongside the financial model.
Account for sales mix and service complexity
A company selling several services needs to understand their individual contributions and expected mix. If a high-contribution service becomes a smaller share of sales, the business may need more total revenue to cover the same fixed costs. A single blended margin can hide this effect unless its weighting is documented and reviewed.
Service complexity also matters. Two jobs sold at the same price may require different delivery effort. Use actual records to identify meaningful categories rather than assuming every job is identical. Scope changes, rework and customer support can turn an apparently standard service into a much more expensive unit.
For a practical first analysis, select one reasonably consistent service or package and define what is included. Then compare the estimated variable cost with several completed examples. If variation is large, investigate the cause before treating the average as a dependable basis for pricing or sales commitments. A more detailed model may be required when services share constrained resources or costs cannot be allocated sensibly.
Keep profit, capacity and cash in view
Breaking even means covering the costs in the model; it does not establish an acceptable return for the owner or resilience against uncertainty. If you want a target profit, include that target explicitly in a separate calculation and explain the additional assumptions. Do not quietly label break-even volume as a healthy sales target.
Check the cash cycle as well. Customers may pay after the business has paid staff and suppliers, so an accounting break-even position can still require working capital. Use the 13-week cash-flow guide to model timing. A break-even calculator cannot replace that view because it does not know when receipts and payments occur.
Use the tool below to explore the economics and prepare questions for your finance and management team. Activ-8 management consultancy can help connect pricing, service design and operational capacity. Bring the offer, typical delivery costs, fixed commitments and expected sales mix. The useful result is a clearer understanding of what must be true for the business decision to work, and which assumptions need testing before commitment.
As a final check, compare the whole-unit break-even requirement with the team's realistic output and recent suitable demand. If the required volume exceeds either, identify the change needed in price, cost, mix or operating model. Treat that gap as a decision to investigate, not simply a more demanding target for the sales team.
TRY IT WITH YOUR NUMBERS
Break-even calculator
Use the same period for fixed costs and the sales volume you are planning. This model assumes one product or a comparable service unit.
Assumes stable price, variable cost, fixed cost and sales mix. Break-even is not a demand forecast, target profit or cash-flow forecast. Non-positive contribution requires a different economic model.
How this calculation works
Contribution per unit = price − variable cost. Break-even units = fixed costs ÷ positive unit contribution. Revenue threshold = fixed costs ÷ contribution margin.
Your inputs stay in this page and are not sent to Activ-8. Download the scenario if you want to keep it.
Discuss what this means for your business ↗Sources & further reading
Primary guidance behind the methods discussed. The examples, diagrams and tools in this article are original Activ-8 material.