THE STARTING POINT
Available hours and deliverable capacity are different; allow for variation, skills and rework.
Capacity planning starts with the work you must deliver
Capacity planning compares the work expected with the resources available to complete it. For a service business, the first model is often based on hours: how many usable delivery hours the team has and how many hours the expected workload requires. This is a useful starting point, but people, skills and work are rarely interchangeable.
The calculator below estimates available team hours, planned delivery capacity, workload hours and the resulting surplus or gap. It is designed for a single, reasonably comparable team and work type. Use separate calculations for different specialist roles or service lines. A combined total can conceal a bottleneck when only one person can perform an essential task.
Begin with the planning decision. Are you considering more sales, a new hire, overtime, subcontracting or a change in scheduling? The model should help compare those options using consistent assumptions. It should not create a universal utilisation target or imply that every unallocated hour is waste. Some flexibility is necessary to handle variation, support colleagues and maintain quality.
Calculate usable hours before applying delivery utilisation
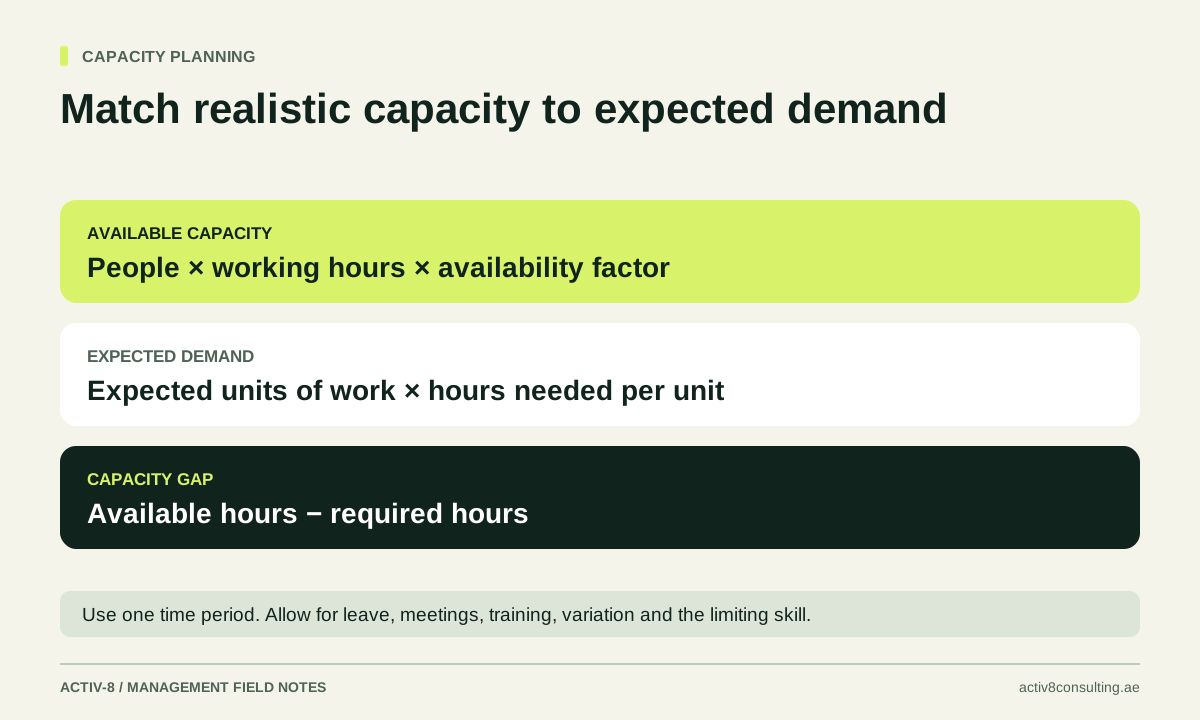
Start with the number of people and their working hours for the chosen period. Deduct known absence and other unavailable time before estimating the share that can be assigned to delivery. Keep the period consistent: weekly demand should be compared with weekly capacity, not a monthly total divided by an arbitrary number.
Then allow for work that is necessary but not directly spent on the service unit you are modelling. This can include meetings, training, administration, preparation and internal support. In the simple calculator, the planned delivery percentage represents the share of available hours intended for the modelled work. It is an assumption to review against actual experience.
Avoid subtracting the same time twice. If your delivery percentage already accounts for routine administration, do not also remove all those hours from the starting total. Write down how the assumption was built. If the team has very different schedules or responsibilities, calculate each group separately and combine only where the work can genuinely move between them.
Estimate demand using a realistic service mix
Demand is the expected number of work units multiplied by the average delivery time per unit. Define the unit carefully: a completed job, processed order, standard report or customer onboarding. Include the work required to finish the unit to the agreed quality, not just the most visible task.
Use recent representative records where possible. If the estimate comes from a time sample, include normal exceptions, preparation and rework. An experienced employee completing an ideal case can provide a useful best-case observation, but it is a poor estimate of ordinary team performance. Explain whether the average is weighted by the actual mix of work.
Where service types differ materially, model them separately. Ten short support requests and ten complex implementations should not be treated as twenty identical jobs. A mixed model might calculate hours for each type and add the demand totals. The process-mapping guide helps identify the work and handoffs that must be included before the estimate becomes reliable.
Work through a simple weekly example
Suppose an illustrative team has six people, each with forty available hours in the week. The starting total is 240 hours. If 75% is planned for the modelled delivery work, effective capacity is 180 hours. At three hours per standard job, that represents capacity for sixty jobs under the stated assumptions.
If demand is seventy jobs, required delivery time is 210 hours. The gap is thirty hours. That is a planning signal, not an automatic instruction to hire. First check whether the demand estimate, service time and utilisation assumption are credible, and whether work can be scheduled differently without breaking customer commitments.
The simple model suggests seven equivalent people would be required at the same hours and delivery percentage: 210 divided by thirty productive hours per person. In practice, recruitment lead time, skills, onboarding and demand variability affect the decision. A seventh person may not solve the bottleneck if the missing capacity is specialist approval that only the existing manager can provide.
Identify the bottleneck and allow for variation
Look at each essential stage of the process. Sales qualification, technical review, delivery and quality approval may have different capacities. The stage with the tightest effective capacity can determine overall throughput. Spare hours elsewhere do not necessarily help unless staff can perform the constrained work or remove supporting tasks from the specialist.
Also consider when demand arrives. A team may have enough hours across the week but still miss Monday deadlines if most work arrives together. Average utilisation does not describe the queue, service deadlines or customer tolerance for waiting. Review workload by day, urgency and skill as well as the overall total.
APM's resource-optimisation guidance discusses matching resources to the schedule. For an SME, that translates into practical questions about sequencing, availability and flexibility. There is no single ideal utilisation percentage for every service business. Set a planning assumption that reflects your variation and service promise, then review actual delays, quality and overtime to see whether the assumption is sustainable.
Compare options before adding permanent cost
When the model shows a gap, investigate several responses. You might simplify the process, reduce avoidable rework, change appointment slots, cross-train staff, adjust the service mix or use temporary support. Each option has a different lead time, cost and effect on quality. Do not assume process improvement can remove every gap, or that hiring is always the first answer.
Distinguish a temporary peak from a sustained requirement. If demand is uncertain, a staged response can reduce the risk of adding fixed cost before the work is dependable. Conversely, repeatedly relying on overtime may be a sign that the planning assumption is unrealistic and the operating model needs attention.
Evaluate commercial choices too. A low-contribution service that consumes the bottleneck resource can crowd out more suitable work. The pricing strategy guide and growth strategy guide help connect capacity with the type of demand the business should pursue. Capacity planning is more valuable when it informs sales promises and service design, rather than becoming a scheduling exercise after commitments are already made.
Review the model against actual delivery
Keep the inputs, date and source of assumptions with the calculation. Review actual workload, available hours, service time, overtime and missed commitments after the period. Explain differences rather than simply replacing the forecast with the result. This builds a more reliable planning method over time.
If the model repeatedly predicts spare capacity while customers experience delays, inspect the bottleneck, timing and hidden work. If actual service time is higher than expected, separate training, complexity and rework effects. A single average can hide a problem that requires a more specific operational response.
Use the calculator below to explore scenarios, then take the result into a working discussion with the team. Inputs stay in your browser and should be treated as planning assumptions. For help connecting workload, processes and commercial commitments, explore Activ-8 operations consultancy. A useful starting brief describes the service, current volume, delivery promise and the point where work regularly queues or requires the owner's intervention.
Try three scenarios before approving a capacity decision: ordinary demand, a realistic peak and a week with a key person unavailable. Compare the service impact and the response available in each. This reveals whether the plan depends on everyone being present and every job taking exactly the expected time, which is rarely a dependable basis for customer commitments.
Keep a record of the assumptions used for each review. A change in job mix, skill coverage or absence can explain a capacity gap even when headcount stays the same. Comparing those assumptions with actual completed work makes the next planning cycle more useful.
TRY IT WITH YOUR NUMBERS
Capacity planning calculator
Compare one team and a comparable type of work over one consistent period, such as a week.
Averages cannot reveal every skill bottleneck, deadline or demand peak. Check the real schedule and quality requirements before making a staffing decision.
How this calculation works
Delivery capacity = people × available hours per person × delivery share. Demand hours = work units × minutes per unit ÷ 60.
Your inputs stay in this page and are not sent to Activ-8. Download the scenario if you want to keep it.
Discuss what this means for your business ↗Sources & further reading
Primary guidance behind the methods discussed. The examples, diagrams and tools in this article are original Activ-8 material.