THE STARTING POINT
Map what really happens, including waiting and rework, before designing the future process.
Choose a start, a finish and a reason for mapping
Business process mapping makes the movement of work visible. It shows the steps, decisions, people and information involved in producing an outcome. For a small service business, that might mean turning an enquiry into an approved quotation, delivering a job or resolving a complaint. The map is useful when it helps explain a problem or design a better way of working.
Begin with a question. Why do quotations take so long? Where does job information get lost? Why do invoices need repeated corrections? A clear question prevents the exercise becoming an attempt to document every activity in the business. Define the starting event and the finished outcome so everyone is discussing the same process.
Include the customer or receiving team's perspective. “The administrator completed the form” may be a task, but it is not necessarily the useful outcome. The next person may need an accurate, approved brief that they can act on. This distinction helps expose handoffs that look complete in one department while remaining incomplete for the person who must continue the work.
Map the current process with the people who use it
Invite people from the main roles involved, including those who receive the output. Ask them to walk through a recent real case, then compare it with other examples. Official procedures are a useful reference, but they may omit workarounds, informal approvals or checks that have developed over time.
ASQ's guidance on flowcharts emphasises participation by the people doing the work and validation of the draft. Apply that principle by asking where the map differs from reality. A manager may believe every enquiry enters the CRM immediately, while staff explain that messages are first discussed in a separate chat and entered later. The difference matters if the business is measuring response time from the wrong starting point.
Keep the conversation about the process rather than blame. People are more likely to reveal workarounds when the purpose is improvement. A workaround may exist because the official method is impractical, information is missing or the system does not support an exception. Record the reason before deciding whether the workaround should be removed, formalised or replaced.
Use simple symbols and clear ownership
A basic flowchart can use boxes for actions, diamonds for decisions and arrows for sequence. Label decision branches with the answer that takes the work down each route. Add a start and finish. Consistent use matters more than sophisticated notation, especially when the map will be used by people who do not work with process diagrams every day.
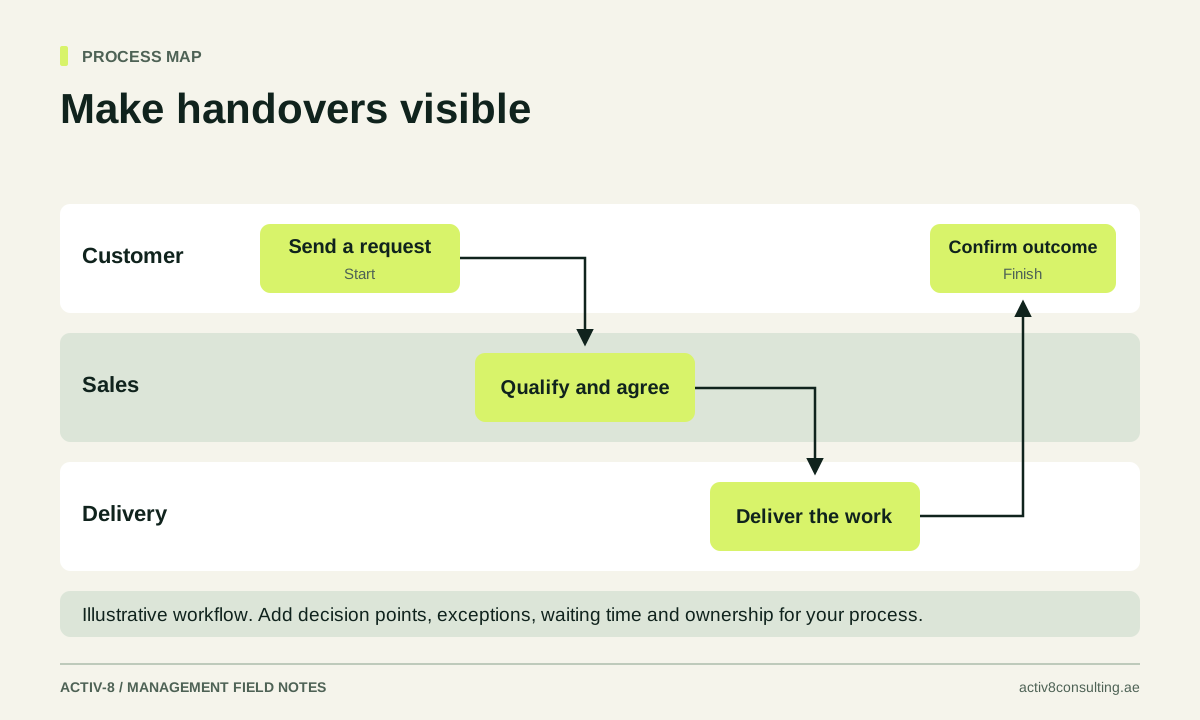
For handoffs between roles, use swimlanes: separate bands for the customer, sales, operations and finance, for example. Place each action in the lane of the role performing it. This makes repeated transfers, unclear ownership and dependence on a single approver easier to see. Include systems where they materially affect the work, but avoid turning the map into a catalogue of software screens.
Name actions with a verb and an object, such as “check service scope” or “approve non-standard price”. Avoid labels such as “processing” that conceal several different activities. If a step contains a complex sub-process, show it at a higher level and create a separate map only when the detail is needed to understand the issue.
Include waiting, information and exception routes
The visible task is often only a small part of elapsed time. Record where work waits for approval, a customer response, supplier information or the next scheduled review. Distinguish active working time from waiting time. A ten-minute approval task may create a three-day delay if it is only reviewed twice a week.
Identify the information required at each handoff and the rule for accepting it. What makes a brief ready for operations? What evidence does finance need before invoicing? If the receiving team must repeatedly ask for missing details, the handoff needs attention even when both teams complete their own tasks quickly.
Map common exceptions alongside the standard route. What happens when the customer changes the scope, a price is unavailable or a job cannot be completed? Do exceptions return to a clear owner, or do they circulate informally? Avoid drawing every rare possibility into the main diagram. Use a separate note or sub-process where necessary to keep the core map readable without pretending difficult cases do not exist.
Add measures that help explain the problem
Once the sequence is agreed, add a few relevant observations. These might include volume, average and longest waiting time, rework frequency, queue size or the percentage of cases missing required information. Use actual records or a clearly labelled sample. Do not fill blank spaces with estimates simply because the map looks unfinished.
An illustrative quotation process might show that the salesperson prepares a draft in twenty minutes, but technical approval takes two working days and one in four drafts returns for missing scope detail. Those numbers would suggest investigating intake quality and approval capacity. They do not, by themselves, prove that either issue causes lost sales.
Keep the measure's definition close to the map. State the sample period, which cases were included and how timestamps were collected. Where cases vary substantially, separate standard and complex work rather than comparing an unhelpful average. The KPI dashboard guide explains how to give ongoing measures an owner and a decision purpose after the mapping exercise is complete.
Design the future process around a hypothesis
Use the current map to identify a specific change. You might remove duplicate entry, clarify the acceptance rule for a handoff, delegate a routine decision or combine checks that use the same information. Ask what must remain controlled and what can be simplified. Removing a step without understanding its purpose can transfer risk to a later part of the process.
Draw the proposed future route separately. Explain the hypothesis: for example, a complete intake brief and defined approval limits should reduce returned quotations and waiting. Identify changes in roles, information, systems and training. A shorter diagram is not sufficient evidence of a better process if it relies on unavailable skills or removes necessary review.
Test the proposed route with representative cases before broad rollout. Include an exception and observe whether people can follow the new method. Measure the effect on the whole outcome, not just the modified step. The process improvement guide shows how to structure the baseline, pilot and decision to keep, adjust or stop the change.
Turn the map into an operating tool
Assign an owner, date and version to the approved map. Store it where the team can find it and connect it to the relevant SOPs, forms and system guidance. The map shows the overall flow; the SOP explains how a particular recurring task is performed. Keeping those purposes distinct makes both easier to maintain.
Use the map during onboarding, incident reviews and process changes. When a recurring problem appears, locate it in the flow and ask whether the issue is information, capacity, authority or an unclear rule. This gives the team a shared reference rather than restarting the discussion from individual impressions each time.
As a practical first exercise, map the last five examples of one important service journey and highlight where they followed different routes. Investigate the differences before standardising them. Activ-8 operations consultancy can help facilitate this work and turn it into a focused improvement plan. The value is not the diagram itself; it is a clearer understanding of how the business produces results and what needs to change.
Before considering the map finished, ask someone from the receiving team to identify exactly what they need at each handoff. If that requirement is absent, add it. This small check often uncovers a gap that an internally focused process discussion misses, especially where several departments each believe their part of the work is already complete.
Sources & further reading
Primary guidance behind the methods discussed. The examples, diagrams and tools in this article are original Activ-8 material.