THE STARTING POINT
Count the full process, including quality checks and exceptions, before claiming an efficiency gain.
Measure the whole process before claiming a saving
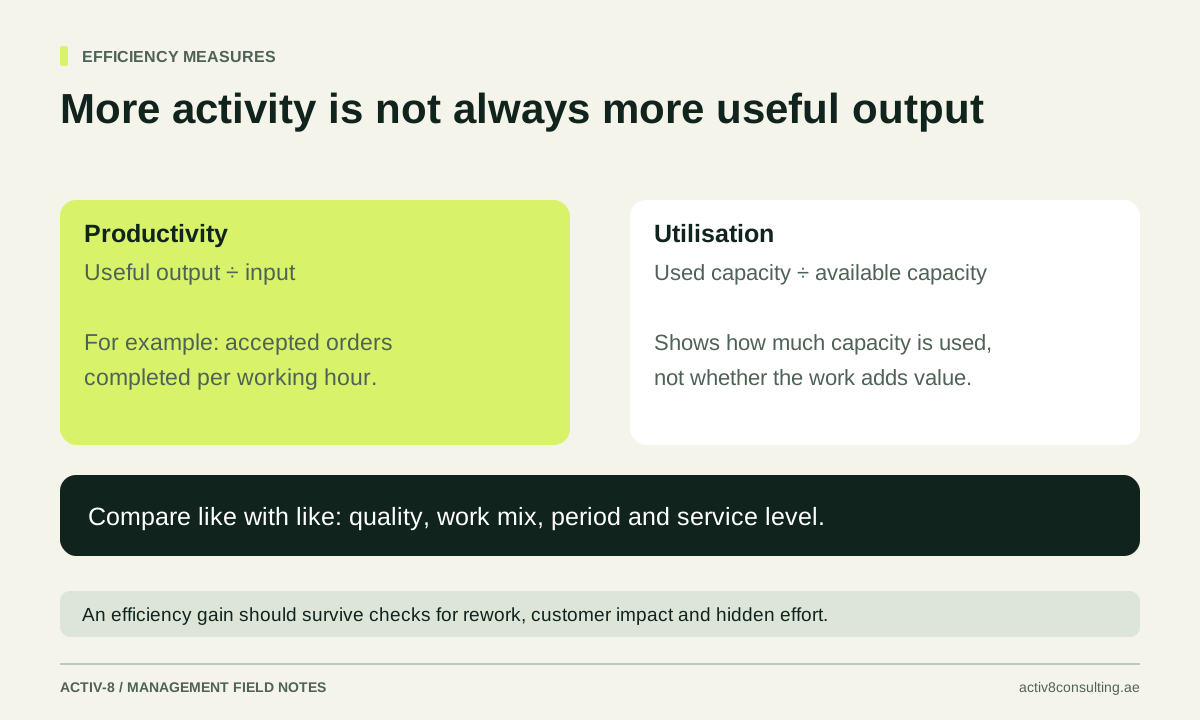
Operational efficiency describes how effectively a business uses resources to produce a useful result. An efficiency calculator can compare the time and cost of a current process with a proposed one. The calculation becomes misleading when it measures only the fastest step, excludes checking and rework or assumes that every hour released becomes a cash saving.
Choose one recurring task with a clear input and output. Examples include preparing a standard report, processing an order or checking a customer brief. Define what counts as a completed, acceptable result. If the new method produces a draft that still needs review, the review is part of the process and belongs in the calculation.
The tool below estimates monthly hours released, their capacity value and the net value after running costs. It also shows simple payback on setup cost where the assumed monthly value is positive. These are planning outputs. They help assess a pilot; they do not establish that the business will reduce payroll or generate additional sales from the released time.
Build a baseline from representative work
Record the number of tasks completed in a typical month and the time required for each. Include preparation, handling, checking, corrections and any work transferred to another person. If the task varies substantially, split it into meaningful categories or use a weighted average based on the actual work mix.
A small time sample can be useful if its limits are clear. Observe ordinary work rather than asking only the fastest employee to demonstrate an ideal case. Include interruptions that are genuinely part of the process, but distinguish unrelated interruptions so the model does not blame the task for everything happening around it.
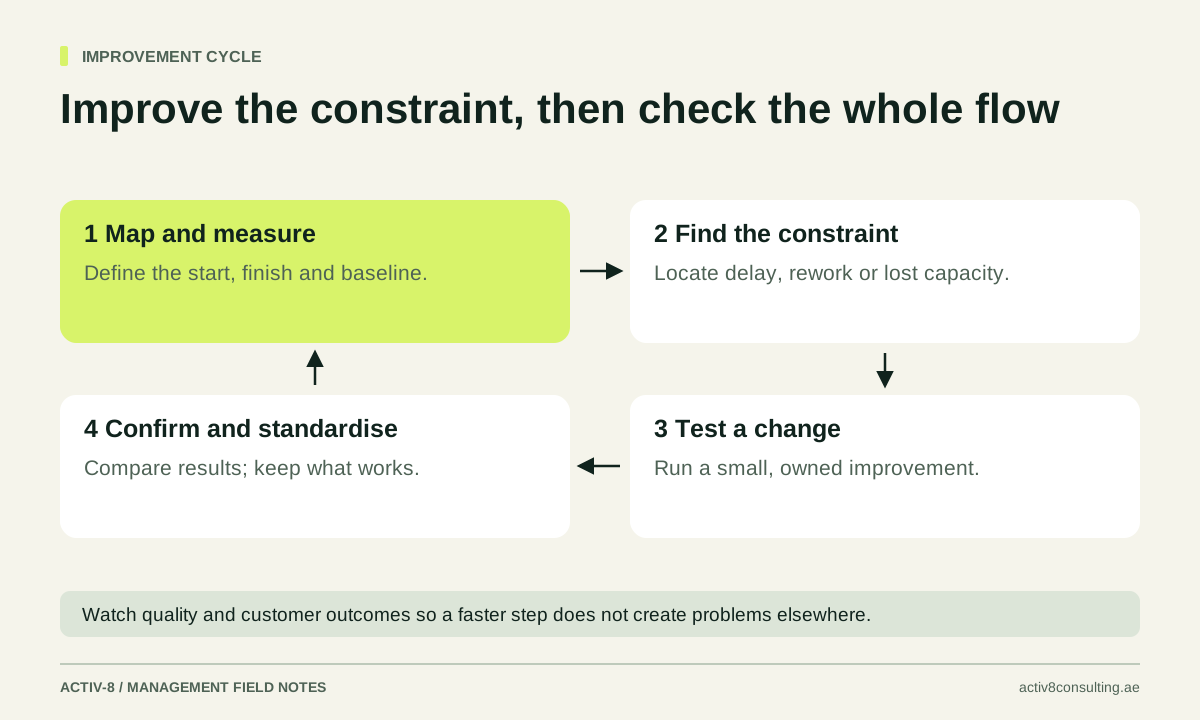
Measure quality alongside time. Record errors, incomplete outputs and occasions when the task must be repeated. If the current process takes twelve minutes but frequently produces a result that another team cannot use, the true baseline includes the subsequent correction. The process-mapping guide helps identify these hidden steps and handoffs before a seemingly precise calculation is built on incomplete information.
Include review, adoption and ongoing ownership
Estimate the proposed process on the same basis as the current one. For an automated or AI-assisted task, include human review, exception handling and maintenance. A tool that generates a draft in seconds may still need several minutes of checking. If the output is difficult to verify, the review burden may be greater than expected.
Use an adoption assumption to represent the share of eligible work that will actually follow the improved method. Some cases may remain unsuitable, and some users may need time or support to change. Keep technical eligibility separate from behavioural adoption in your notes, even if the simple calculator combines them into one effective percentage.
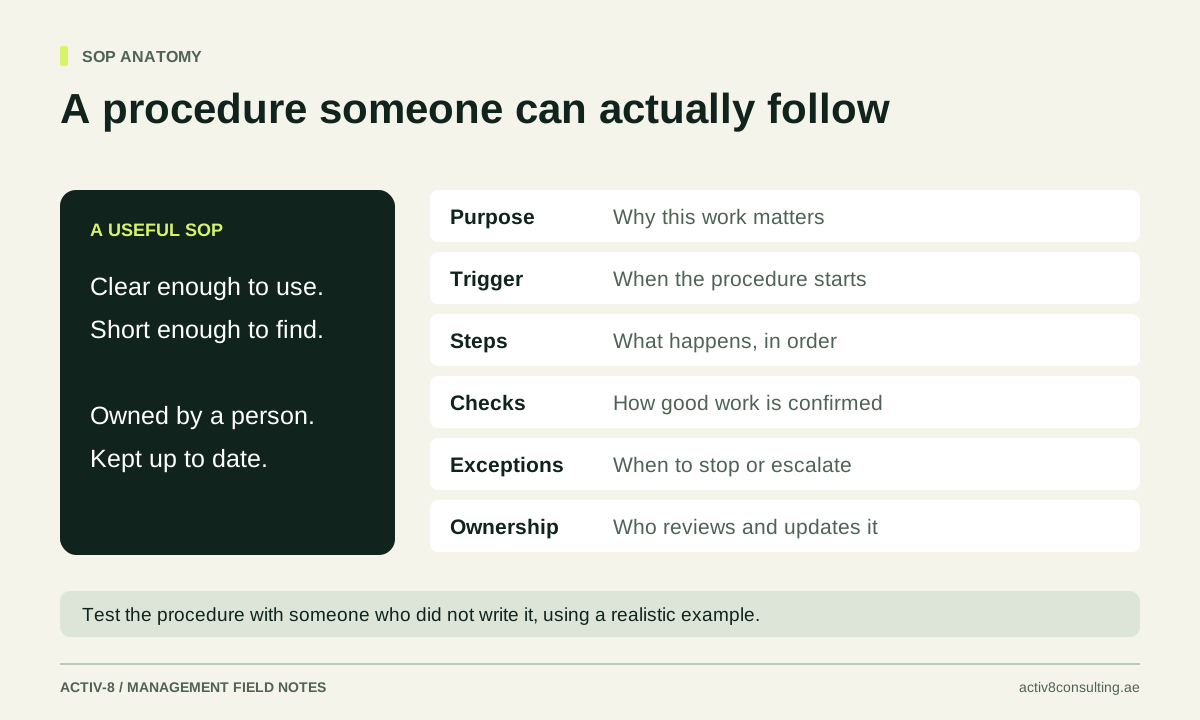
Include recurring software and support costs. Someone must own the process, update rules, deal with failures and check performance. If those activities are material, include their time in the proposed handling estimate or record them as a separate running cost. Avoid claiming a permanent benefit from a pilot that has not yet established who will keep the new method working.
Work through a monthly time-saving example
Suppose an illustrative reporting task occurs 200 times per month. The current process takes twelve minutes per task. The proposed method takes five minutes including review. If it is used for 80% of the tasks, the gross time released is 200 multiplied by seven minutes multiplied by 80%, or 1,120 minutes. That is approximately 18.7 hours per month.
At an assumed fully loaded hourly value of AED 100, the released capacity is valued at roughly AED 1,867. With AED 400 of monthly running cost, the estimated net capacity value is about AED 1,467. If setup costs AED 6,000, simple payback on that capacity-value basis is approximately 4.1 months after the benefit starts.
This does not mean the bank account improves by AED 1,467 each month. If existing salaries remain unchanged and the released time is not used productively, the cash benefit may be much smaller. Label the output correctly. The example is designed to show the arithmetic and the distinction between capacity value and cash savings, not to promise a particular return from automation.
Decide how the released capacity will be used
Ask what changes operationally when the hours become available. Will the team handle additional demand, reduce overtime, improve response times or complete neglected quality work? Name the intended use and the manager responsible. Otherwise the projected benefit can disappear into general busyness without changing a business outcome.
If the case depends on additional sales, check that demand exists and convert the expected revenue into contribution after delivery costs. If the case depends on lower external spending, identify the specific invoice or commitment that will reduce. Do not count both the full value of released time and the full contribution from work performed in that same time without checking for overlap.
Some benefits are worthwhile even when they are difficult to monetise. A more reliable report may improve decisions, or a less repetitive process may improve resilience when a team member is absent. Describe these outcomes and the evidence you will collect. The consulting ROI guide explains how to combine financial and operational considerations without inventing a cash value for every improvement.
Stress-test the proposed improvement
Change the assumptions one at a time. What if the task volume is lower, review takes longer or only half the eligible work uses the new process? What if software costs rise or maintenance requires a few hours each month? A decision that works only under the best assumptions may need a smaller pilot or a different design.
Check whether the new method changes quality. A faster process that increases incorrect invoices, unsuitable customer responses or missed exceptions can create costs elsewhere. Include a quality threshold and a fallback route in the pilot. Staff should know when to stop the automated route and return to the established method.
Also consider the timing of benefits. Setup, training and early corrections can consume capacity before the improvement becomes dependable. Simple payback assumes the monthly net benefit continues steadily once it starts; it does not model a detailed ramp-up or discount future cash flows. For a larger investment, build a more detailed schedule and have the assumptions reviewed by the appropriate finance and operational owners.
Verify the result after implementation
Retain the original baseline and repeat the measurement on comparable work. Record actual adoption, total handling time, errors and running costs. Explain whether changes in volume or work mix contributed to the result. A lower average time is more persuasive when the quality and sample boundaries remain consistent.
Review the intended use of the released capacity. If the objective was reducing overdue work, check whether overdue work actually fell. If it was avoiding overtime, compare paid overtime on a like-for-like basis. These outcome checks prevent a theoretical saving from becoming a permanent management claim without evidence.
Use the calculator below to frame the first test, then use the observed results to decide whether to expand. Activ-8 operations consultancy can help identify the right process and establish the baseline, while our AI integration service supports suitable technology use cases. The strongest brief explains the repeated task, its volume, current effort, quality requirements and what the business would do with the time released.
Before sharing a result internally, label it as estimated, piloted or verified in routine operation. Include the period and assumptions. That small distinction protects the credibility of the improvement programme and makes it easier for the next manager to understand whether the number is an ambition, an early observation or a dependable operating result.
TRY IT WITH YOUR NUMBERS
Operational efficiency calculator
Compare the full current and proposed process, including checking and exceptions. Capacity value is not automatically cash saved.
Released time is not automatically a cash saving. Show how it will reduce spending, absorb demand or support another useful outcome. Include quality, exceptions and maintenance in your review.
How this calculation works
Hours released = task volume × (current minutes − proposed minutes) × adoption ÷ 60. Net capacity value = hours released × hourly value − running cost.
Your inputs stay in this page and are not sent to Activ-8. Download the scenario if you want to keep it.
Discuss what this means for your business ↗Sources & further reading
Primary guidance behind the methods discussed. The examples, diagrams and tools in this article are original Activ-8 material.