THE STARTING POINT
Link measures through a clear business hypothesis instead of collecting unrelated indicators.
Use the scorecard to explain how the strategy should work
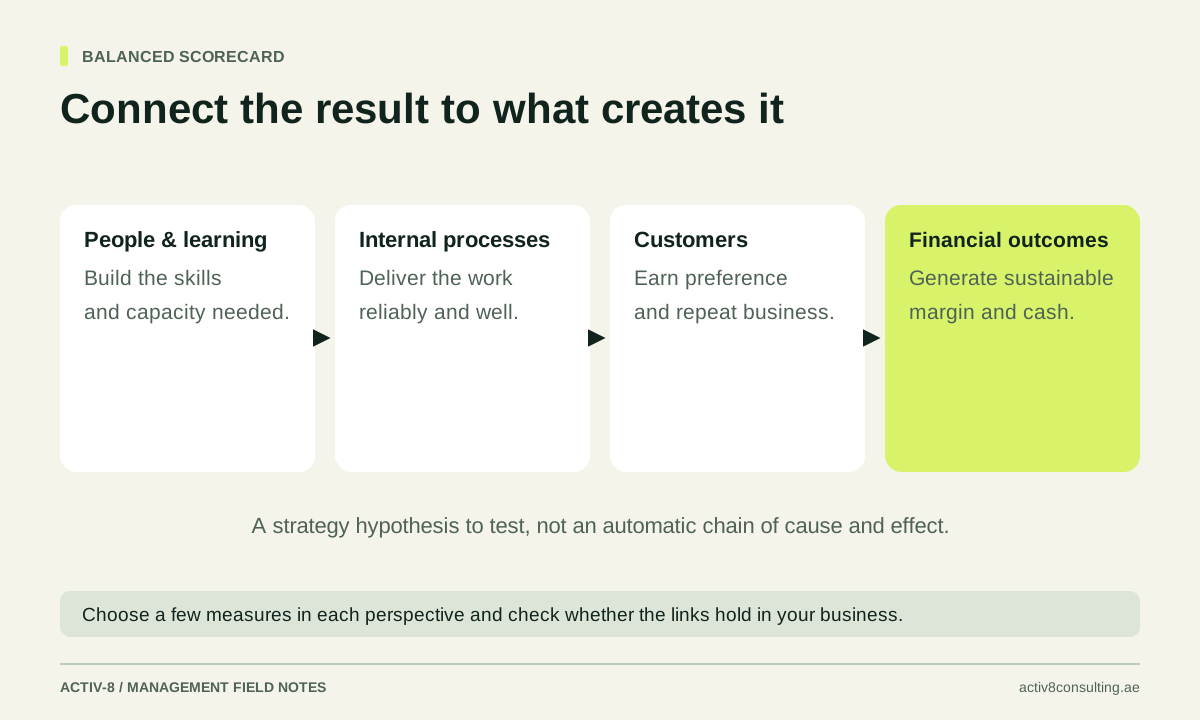
A balanced scorecard connects business objectives and measures across financial results, customers, internal processes and organisational capability. For a small business, its value is the relationship between those perspectives. It encourages leaders to ask what must improve inside the company to create a better customer outcome and, in turn, a stronger financial result.
It should not become a requirement to fill four boxes with equal numbers of KPIs. The scorecard needs to reflect your strategy and business model. A compact set of connected measures is usually more useful than a large collection of departmental statistics with no explanation of how they fit together.
Start with a strategic choice. An illustrative business-support company might aim to build a dependable recurring service for existing clients. The scorecard should then describe the financial outcome sought, the customer experience that supports it, the process changes required and the capability needed to deliver them. Without that starting choice, the exercise can become another dashboard design project rather than a management tool.
Define the financial result without ignoring timing
The financial perspective asks what economic outcome the strategy should create. Relevant measures might include contribution from the priority service, recurring revenue quality, operating profit or cash collection. Choose measures that explain the business model rather than relying only on total sales.
For the illustrative company, growing recurring revenue would be incomplete as an objective if the service consumes excessive senior time. Contribution per client and the cost of delivery could provide necessary context. The team might also monitor overdue balances because a profitable-looking contract can still create cash pressure when collection is slow.
Keep targets, forecasts and actual results distinct. A desired margin is not evidence that the current service will achieve it. Use actual delivery records to improve the forecast and explain changes in price, volume, mix or cost. The management reporting guide shows how to connect these results to a decision discussion without overwhelming the main scorecard with every line of the accounts.
Identify the customer outcome that supports the economics
Ask what the priority customer must experience for the strategy to succeed. That could be dependable delivery, a simpler buying process, fewer unresolved issues or a service that helps them make decisions faster. Avoid assuming that a general satisfaction score explains the whole relationship.
For the recurring-service example, the customer outcome might be receiving a useful monthly review on time, with clear actions and consistent follow-up. Measures could include delivery against the agreed schedule, action usefulness gathered through structured feedback and renewal behaviour. Each source has limitations, so interpret them together rather than treating one score as proof of loyalty.
Use evidence from real customers to test the connection. A client may renew because changing supplier is inconvenient, even while experiencing frustration. Another may be satisfied but no longer need the service. The customer journey mapping guide helps organise the experience around customer goals, handoffs and friction, which can reveal a more useful improvement than simply asking staff to increase satisfaction.
Choose the internal processes that matter most
The process perspective asks what the business must do reliably to deliver the customer outcome. Focus on the few processes that are critical to the chosen strategy. These could include qualification, onboarding, data preparation, scheduling, quality review or issue resolution. Do not add every operational measure simply because it is available.
In the example, late customer reviews may begin with incomplete information arriving too close to the meeting. The relevant process objective could be a dependable preparation and readiness check. Measures might track complete inputs by the agreed cut-off, rework in the review pack and the age of unresolved actions.
Look across department boundaries. A sales promise can create a delivery problem if the service scope is unclear. A finance requirement can delay onboarding if it is introduced too late. The process improvement guide explains how to test a change across the whole outcome. A balanced scorecard is most helpful when it makes these connections visible rather than encouraging each function to optimise its own number in isolation.
Include capability that the strategy genuinely requires
The capability perspective concerns the people, information, systems and working practices needed to deliver the processes. This is sometimes labelled learning and growth. For an SME, it might involve manager decision authority, skill coverage, reliable data definitions or the ability to maintain a new system without depending on one person.
Avoid using training hours as the only evidence of capability. Attendance shows that an activity occurred, not that someone can perform the work. For the recurring-service example, a more useful check might be whether another manager can prepare and lead the customer review to the agreed standard, including handling common exceptions.
Connect investment to the process it supports. If the strategy needs reliable preparation, then clear templates, data ownership and staff practice may be more important than another reporting platform. Name the capability gap and the evidence that would show it has closed. This prevents the scorecard becoming a justification for unrelated software or training purchases that happen to fit the heading.
Draw the connections as hypotheses to test
Write the proposed chain in ordinary language: better data ownership should improve preparation; better preparation should improve the customer review; a more useful and dependable review should support retention and contribution. These are hypotheses, not guaranteed causal relationships. The scorecard helps the team decide what evidence to collect.
If preparation improves but renewals do not, investigate whether the service is valuable, correctly priced and aimed at the right customers. If renewals improve while contribution falls, check scope creep and delivery cost. A connected view encourages better questions than celebrating each green metric independently.
Keep time lags in mind. A capability improvement may take several delivery cycles to affect customer experience, and renewal outcomes may appear later still. Define the expected sequence and review period. Avoid claiming immediate financial causation from a recently completed training session or process change. External demand, customer circumstances and other business changes may also influence the result.
Keep the scorecard small, owned and reviewable
A useful workshop exercise is to remove the financial measures temporarily and ask how the remaining objectives would improve the economics. Then reverse the exercise: for each financial objective, identify the customer and process changes needed. Gaps in either direction reveal where the scorecard is collecting measures without explaining the strategy.
For each measure, define the calculation, source, owner and update frequency. Use the KPI definition worksheet to avoid ambiguity. Record the baseline and explain why the target is appropriate. If the data is incomplete, show the limitation rather than making the scorecard look more certain than the records allow.
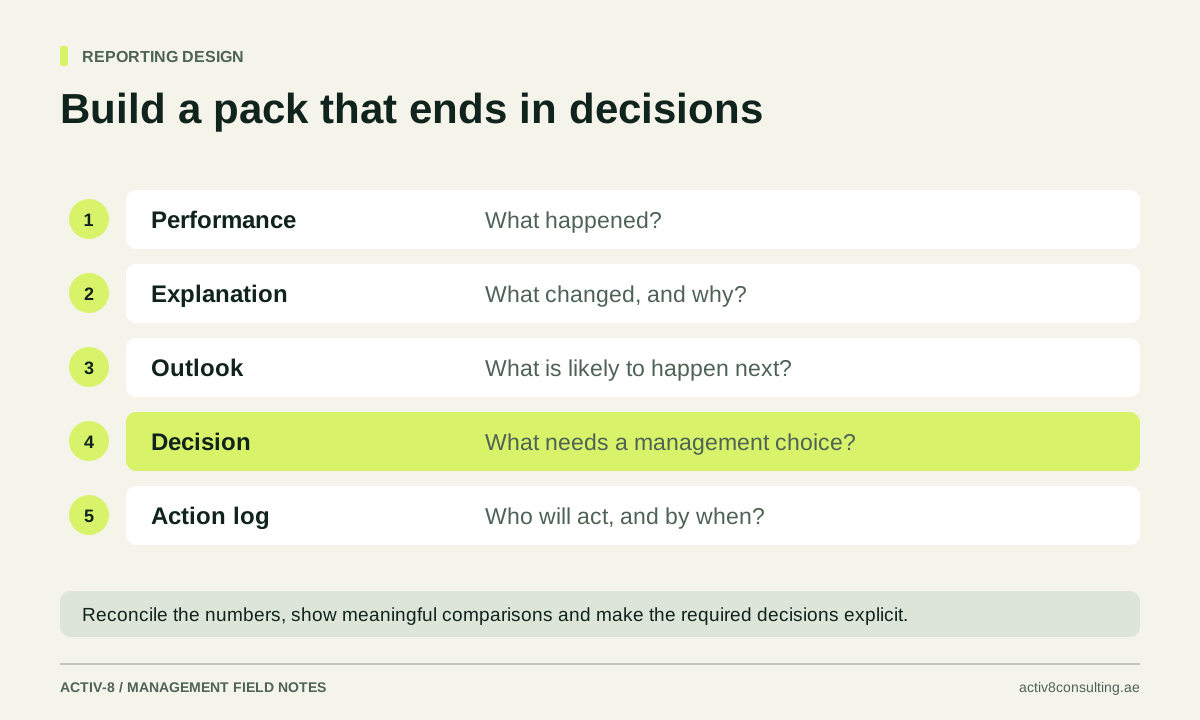
Review the scorecard in a management meeting that produces decisions. Ask which relationship appears to be working, which assumption is weak and what action is required. Keep supporting detail available for investigation, but make the main page readable enough that managers can understand the business story without a long presentation.
Start with one strategic theme and a few connected measures. After several review cycles, remove indicators that do not inform a decision and improve definitions that repeatedly cause debate. Activ-8 reporting and business intelligence can help connect strategy, data and the management rhythm. The intended result is a scorecard that explains how progress should happen and gives the team evidence for adjusting the plan when reality differs.
Before adding a new metric, place it in the chain and explain the action it supports. If it has no clear relationship to the strategy, keep it in an operational report instead. This protects the scorecard's role as a focused view of the business choices that matter most during the current period.
Sources & further reading
Primary guidance behind the methods discussed. The examples, diagrams and tools in this article are original Activ-8 material.
Put the thinking into practice.
Explore reporting and business intelligence Discuss your business with Mark