THE STARTING POINT
Use comparable definitions and denominators, then investigate maturity, mix and service quality before ranking branches.
Compare performance on a fair basis
Compare branch performance using consistent definitions, fair denominators and a clear view of each branch's maturity, service mix and available capacity. Revenue alone cannot tell you which location is operating best. A larger branch may sell more but retain less contribution, while a newer branch may be improving quickly from a smaller base. Start with the management decision, then compare like-for-like work and investigate the differences before ranking the teams.
Decide what the comparison should change
Are you deciding where to add capacity, which operating practice to copy or whether a branch needs support? Each question requires a different view. A league table without a decision can create competition while leaving the underlying business unchanged. Write down the action management could take if a measure moves materially.
For a UAE business operating across locations, do not assume geography explains every difference. Branches may have different opening patterns, customer mixes, service capabilities or stages of development. Record those facts before attributing results to the manager. Use evidence specific to your operation rather than broad claims about how customers behave in a particular emirate.
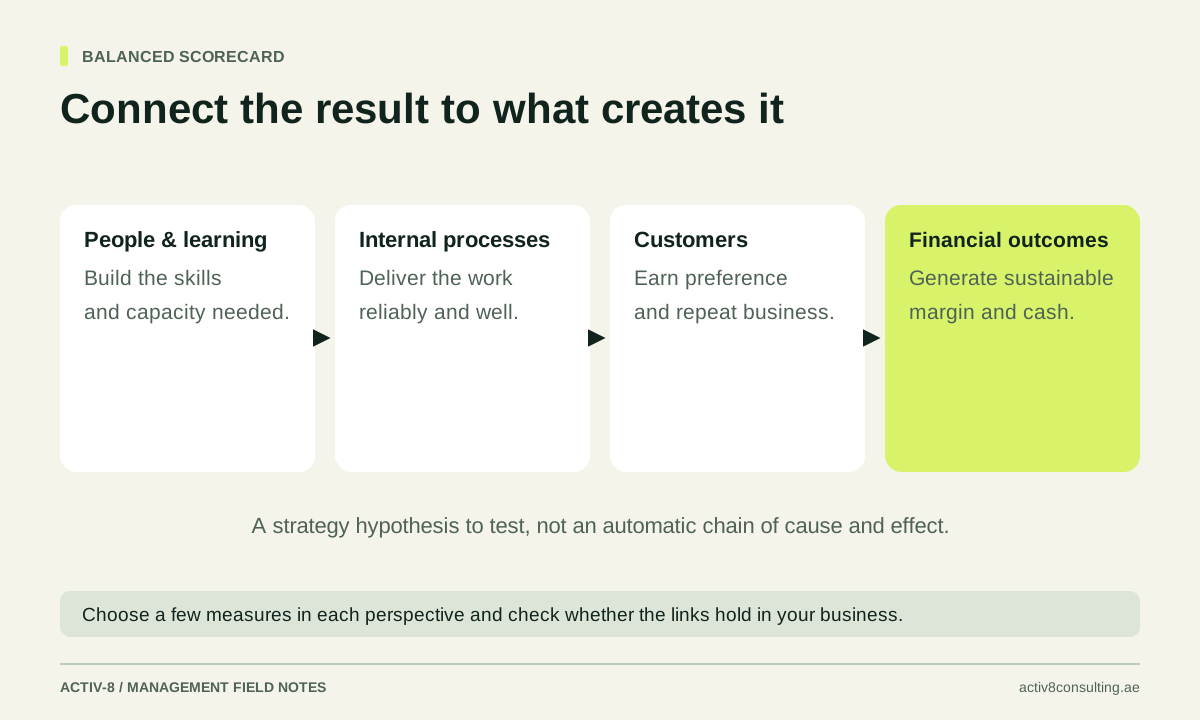
Choose a compact set of measures covering commercial performance, delivery, customers and people. Our balanced scorecard guide helps connect those perspectives. The aim is a useful explanation of performance, not a dashboard with so many indicators that every branch can find one on which it appears strongest.
Standardise definitions before comparing results
Create a short metric dictionary shared by all branches. For revenue, specify the period and basis used by the finance records. For completed jobs, define completion and how cancellations or repeat visits are treated. For available hours, state whether the figure refers to scheduled presence or realistic delivery time. Small differences in definitions can produce large apparent performance gaps.
Identify the data source and owner for each measure. Check several records from each branch against the definition. If one location counts an order when booked and another when delivered, resolve that difference before publishing a ranking. A centrally consistent report is only useful if the underlying events are being recorded consistently too.
Keep changes to definitions visible. When a new system or process changes what is counted, show the break in comparability rather than silently joining the old and new numbers. Branch managers need to trust that the comparison describes the same thing at each location and that corrections can be made openly.
Choose denominators that fit the question
Revenue per branch answers a scale question. Revenue per completed job speaks to value and mix. Contribution per productive hour can help assess how scarce delivery capacity is being used. Each denominator highlights a different part of the operation, and none is a universal measure of managerial quality.
Use comparable periods and consistent units. If one branch has more operating days, compare both total performance and performance per relevant operating day. If one branch has more skilled capacity, consider output per available delivery hour as well as total output. Do not divide by a denominator that excludes the difficult work while leaving its revenue in the numerator.
Show the underlying volume beside ratios. A 100% result based on three customer responses is different from the same result based on several hundred. Small samples can be informative, but they need interpretation. Avoid creating precise rankings from differences that the available evidence cannot support confidently.
An illustrative two-branch comparison in AED
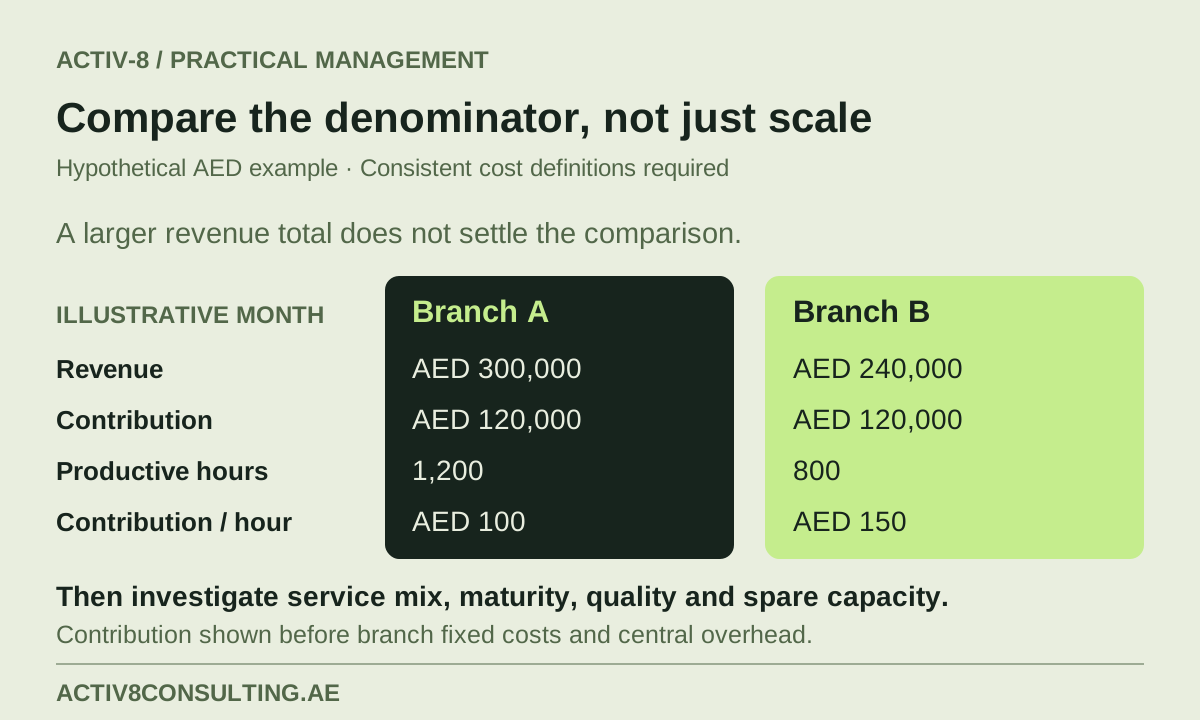
Imagine two hypothetical service branches in the UAE. Branch A records AED 300,000 of revenue and AED 180,000 of directly attributable variable delivery costs in a month. Branch B records AED 240,000 of revenue and AED 120,000 of comparable variable costs. Each therefore generates AED 120,000 of contribution before branch fixed costs and central overhead, using this deliberately simplified definition.
Branch A uses 1,200 productive delivery hours, giving AED 100 of contribution per hour. Branch B uses 800 hours, giving AED 150 per hour. Branch A leads on revenue, while Branch B leads on this contribution-per-hour measure. Neither result alone establishes which manager is better or which branch should expand. The service mix, quality and remaining capacity still matter.
Suppose branch fixed costs are AED 70,000 for A and AED 60,000 for B. The resulting amount before central overhead is AED 50,000 for A and AED 60,000 for B. These fictional figures show why the definition of contribution and the treatment of costs must be explicit. They do not establish an expected margin or performance benchmark for UAE branches.
Separate branch economics from overhead allocation
Show costs that are directly associated with each branch separately from shared central costs. Then explain any allocation method used for the latter. A branch can appear weaker simply because the business changed how head-office costs were distributed. Management needs to distinguish that reporting effect from a change in local operations.
Use the allocation for its intended purpose. A fully allocated profitability view may help assess the business model, while an incremental decision about adding work may require a different cost analysis. Do not switch between these views without labelling them. The same cost can be relevant to a long-term branch decision and unchanged by a small short-term volume change.
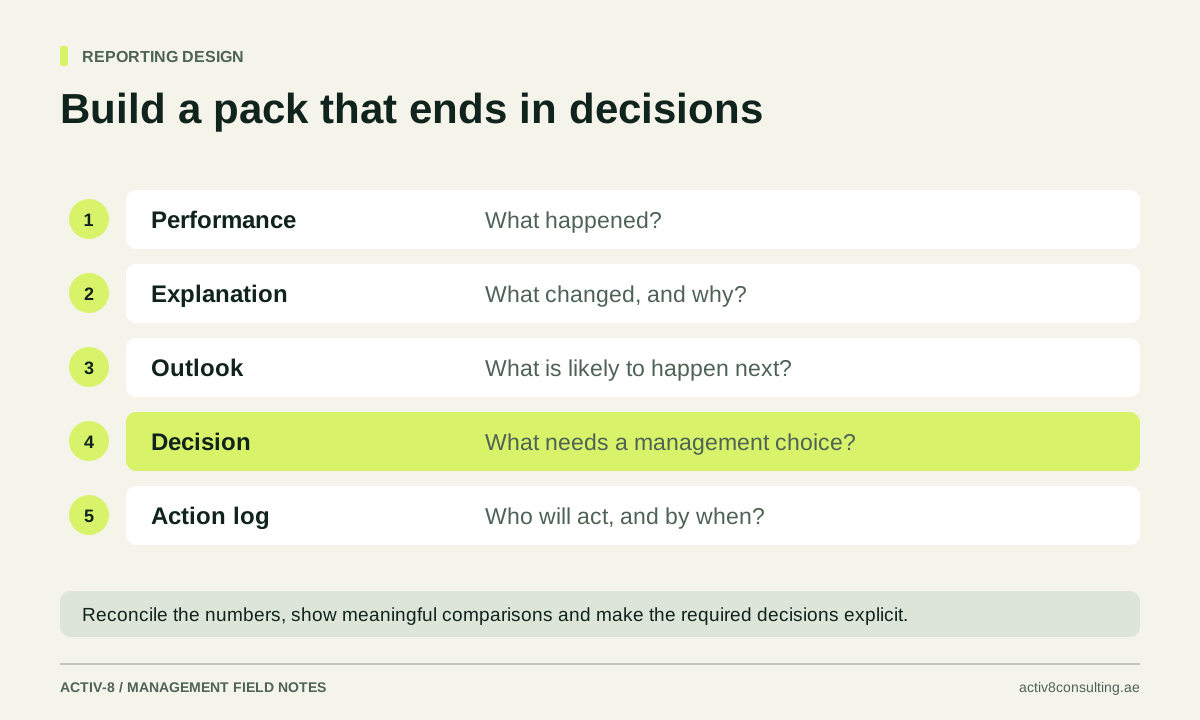
Ask the finance team to reconcile branch totals with the company view. Missing shared revenue, duplicated costs or inconsistent transfers can undermine confidence in the entire comparison. Our management reporting pack guide explains how to present a connected picture rather than disconnected branch reports.
Adjust interpretation for maturity and service mix
Compare a new branch with its own opening plan and development trajectory as well as mature branches. Early operating costs, incomplete capacity and a developing customer base may explain a different result. That does not excuse every gap, but it changes the question from “Why are you smallest?” to “Are the assumptions and progress credible?”
Segment service types where their economics or workloads differ materially. A branch completing more complex work may have lower jobs per hour but higher contribution per job. Examine the mix before concluding that the team is slow. Where useful, compare the same service across branches and then return to the overall branch view.
Keep external and internal explanations separate. A genuine difference in local demand may require a commercial response; a repeated scheduling failure may require an operational one. Ask for evidence supporting each explanation. Context should improve the diagnosis, not become a permanent reason to avoid accountability.
Pair financial measures with service and capacity
A branch can improve its short-term contribution by deferring necessary maintenance, reducing checks or accepting work it cannot deliver reliably. Include a few guardrails relevant to your business, such as rework, unresolved complaints, completion reliability and backlog. Define them consistently and review the actual cases behind material changes.
Capacity deserves its own view. A high-performing branch that is already constrained may need investment, while a branch with spare capability may need demand or a different work allocation. Show the practical bottleneck: people, skill, equipment, scheduling or customer access. A single utilisation percentage can conceal an important specialist constraint.
Review staff workload alongside output. Comparing teams fairly means recognising the work required to produce the result, including necessary support and exception handling. This does not require a complicated time-tracking system for every minute. A representative workload study can identify whether a seemingly efficient branch is relying on unsustainable hidden effort.
The Go Green Taxis case study describes Mark Parham's CEO and consulting work across a growing service business. It provides context for connecting leadership, commercial decisions and forecasting. It does not establish branch-level benchmarks; the fictional branch figures here remain a separate teaching example.
Use the review to transfer learning
Ask each branch to explain one material variance and one practice worth testing elsewhere. Choose a specific operating method, such as how incomplete orders are resolved, rather than copying an entire branch's behaviour without context. Define a small trial and the evidence that would support adopting it more widely.
The downloadable branch comparison worksheet helps record metric definitions, denominators, context and the resulting decision. Replace its illustrative rows and keep the financial basis consistent with your own records. Use the notes to capture uncertainty instead of forcing every branch into a simplistic score.
Activ-8 reporting and business intelligence consultancy can help build a branch view that supports fair decisions and practical improvement. A good comparison should show where performance differs, explain what is genuinely comparable and lead to an action that improves the business as a whole.
PUT IT INTO PRACTICE
Branch performance comparison worksheet
Replace the fictional branch rows with comparable periods from your records. Keep the contribution definition and productive-hour basis consistent. Add maturity, service-mix and quality notes before deciding what action the comparison supports.
Download the worksheetCSV file · Opens in Excel or Google Sheets · No sign-up required
Put the thinking into practice.
Explore reporting and business intelligence Discuss your business with Mark